

Chrome DevTools, Extensions, & Pro Tips for Web Developers
Chrome DevTools, Extensions, & Pro Tips for Web Developers
Learn how to debug efficiently and optimize website performance using powerful built-in tools and helpful add-ons in your browser.

Chrome developer tools and extensions are extremely helpful and important for web developers.
In this article, I will show you eight essential Chrome extensions that will boost your productivity, all the DevTools features that will streamline your workflow, and pro tips to speed up your development process.
Let’s dive in!
Extensions
Let’s start with extensions. I prefer using Google Chrome as my daily browser because it’s fast and offers a good developer experience.
However, most of the extensions that I use have equivalents or similar alternatives on Safari, Edge, and other browsers.
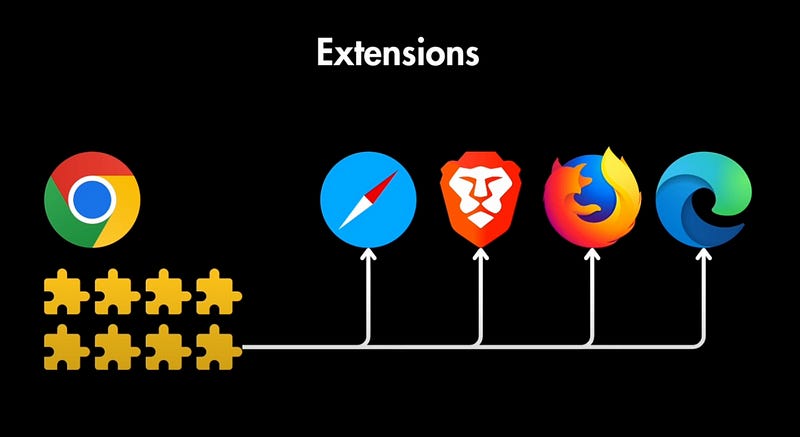
So, if you use a different browser, you can simply search for the extension name, and you’ll find it in your browser.
Adblock Plus: The first extension is Adblock Plus, which will block ads on websites you visit, eliminating distractions. Although it’s not exclusively for developers, it can be a helpful tool.
React Dev Tools / Vuejs Devtools: These extensions are essential for debugging React or Vue applications. You can inspect components, see their props and state, and much more.
Redux Dev Tools: If your app uses Redux, this tool will add a separate Redux tab in dev tools, which will help you debug its state.
Dark Mode: This enables dark mode on websites that don’t have it, such as Google Calendar, Google Sheets, etc.
JSON Formatter: Makes raw JSON data readable. If you have a compressed JSON file, you can paste it here, and it will format it nicely.
ColorZilla: ColorZilla helps you grab the exact color you want. It’s just a color picker but in your browser.
WhatFont: Similar to ColorZilla, this extension gives you the font from a website. If you see a font on another website that you like and want to use in your design, you can determine the font with this extension.
Screenshot Tool: Lastly, we have this screenshot tool, which allows you to take quick screenshots with your preferred resolution. It’s helpful when you want to screenshot your projects to put them in your portfolio.
Developer Tools
Now, let’s take a look at the developer tools in our browser. You can access them by right-clicking and selecting “inspect element” or by pressing fn+f12.
The core tabs that you will use the most are:
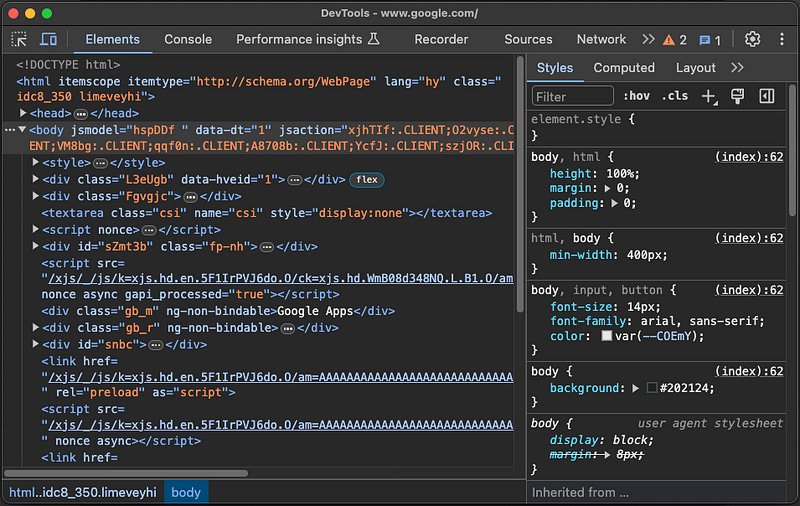
Elements: This tab is your control center for HTML and CSS. You can inspect the structure of your web page and view the CSS styles applied to the elements. You can also make edits directly in this tab and see the live results on the screen.
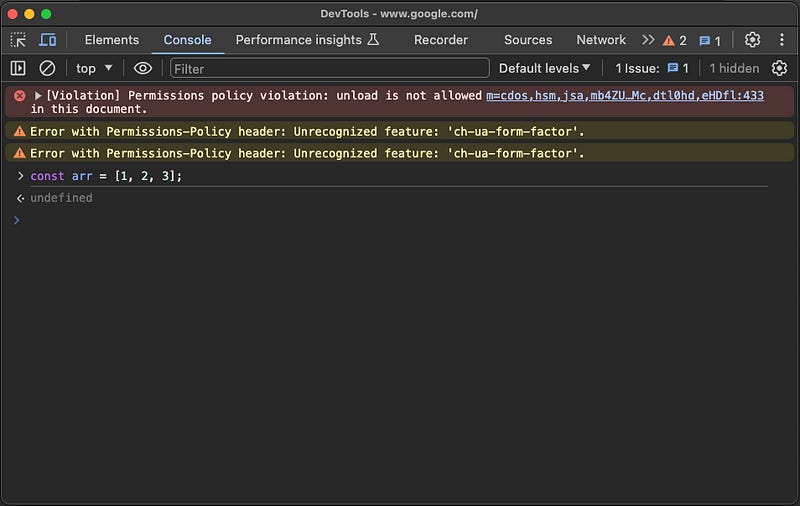
Console Tab: This is where you can interact with JavaScript. You can even run JavaScript code directly in this tab, but it is mainly used for checking errors or log messages while debugging an application.
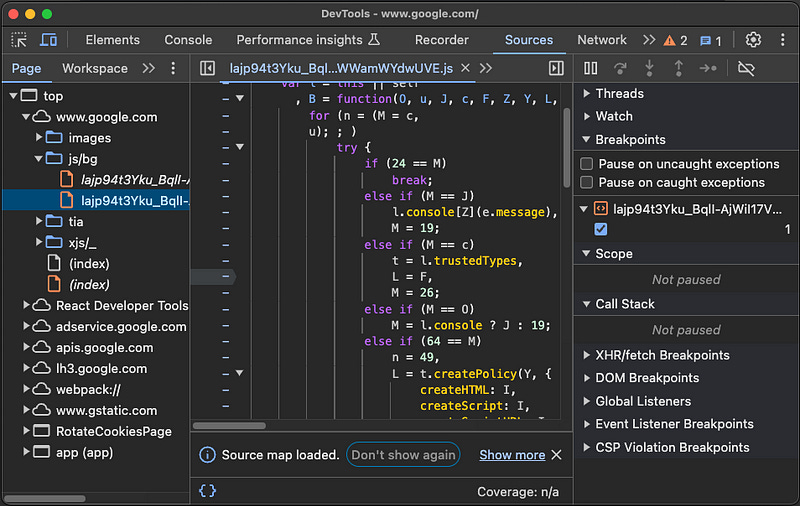
Sources Tab: If you need to debug your JavaScript code in more depth, then you can use the Sources tab to set breakpoints. This way, you can pause the code execution and run through your code line by line.
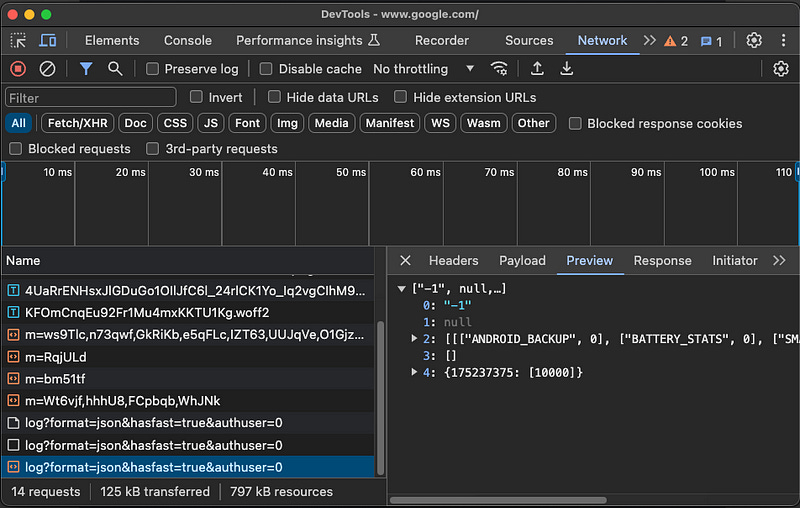
Network Tab: This tab displays every resource a website loads, such as HTML, CSS, JS files, images, icons, etc.
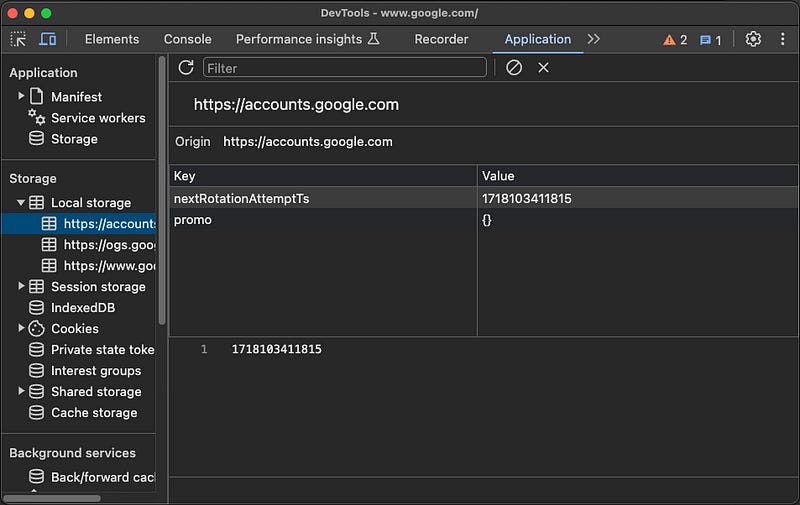
Application Tab: This is another useful tab to inspect and manage app storage. You can check your cookies, local storage items, sessions, and background services like background cache, services workers, etc.
Performance Tabs
To analyze the performance of your website in-depth, you can use the following tabs:
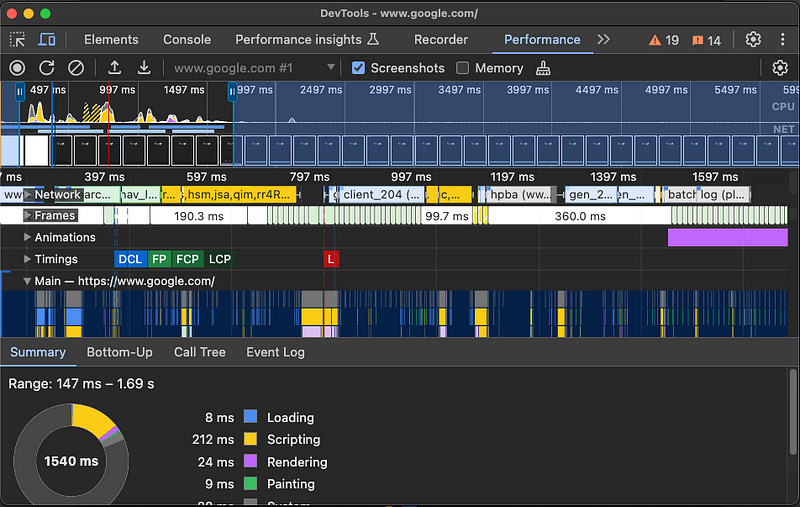
Performance: This tab helps you to profile your site’s load times and identify bottlenecks. If you want to optimize your website’s speed, this is one of the first places you might look into.
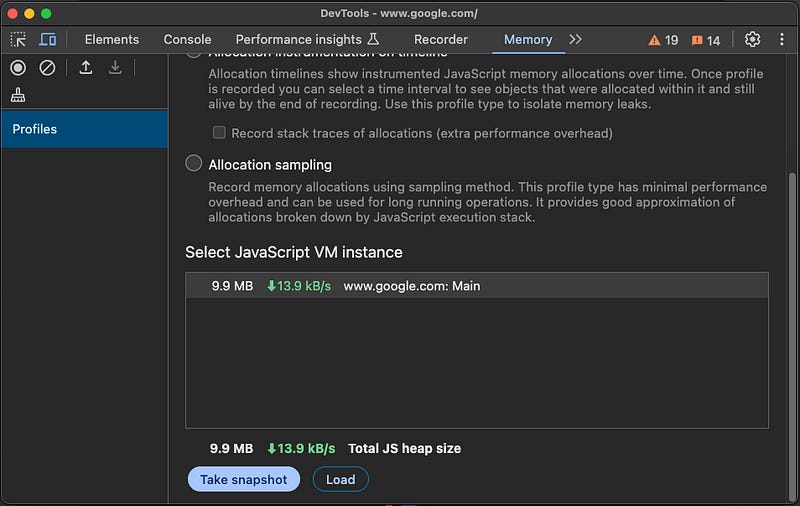
Memory: The Memory tab is for tracking memory usage and identifying memory leaks.
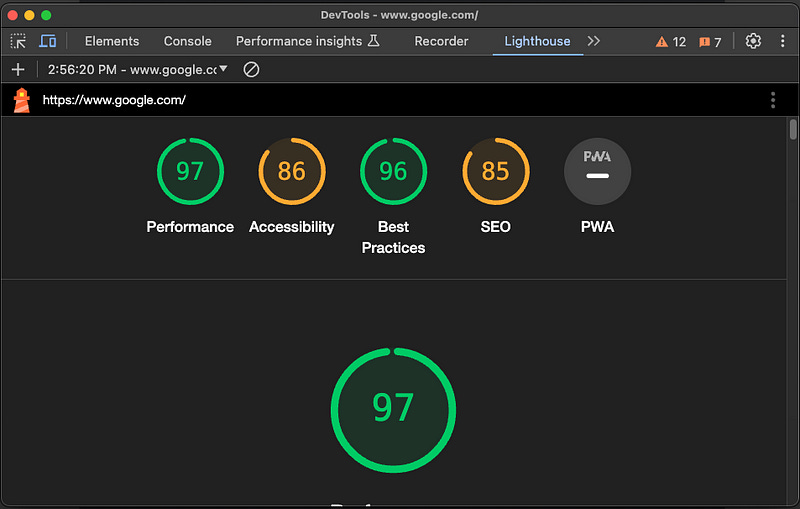
Lighthouse Tab: Lighthouse tab is a handy auditing tool where you can run audits for performance, accessibility, and SEO optimization.
Performance Insights: This tab is still considered an experimental feature. Here, you can gain even more detailed insights into performance optimization. It analyzes your site’s loading process, pinpointing specific elements or tasks that might slow things down.
Other tabs
Redux + Adblock Plus: These tabs were added by the extensions that we installed. The Redux tab will be very useful when you work with an application that uses the Redux state.
Recorder Tab: And recorder tab helps you to capture and replay user interactions to identify errors or automate testing.
Pro Tips
And lastly, here are some advanced tips to enhance your development workflow:
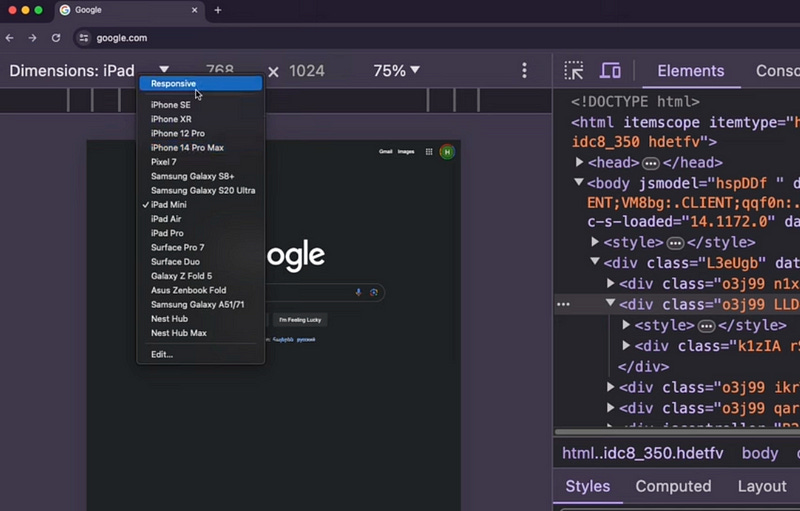
Responsive Design: To test your website across various screen sizes and resolutions, you can click on the top left icon and select the desired device resolution or enter your custom resolution.
Select an Element: The other icon near it allows you to select an element from your screen by hovering over it.
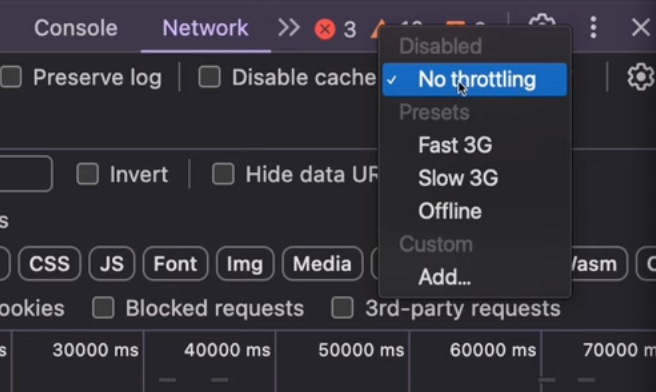
Network Throttling: If you want to check how your website performs on slower connections, you can set the network throttling to slow 3g or create your custom rules in the network tab.
Conditional Breakpoints: You can use conditional breakpoints to pause code execution only when specific conditions are met.
Set a breakpoint at the line of code you want to inspect.
Right-click on the breakpoint dot (usually a red circle next to the line number).
Select “Add condition…” from the context menu.
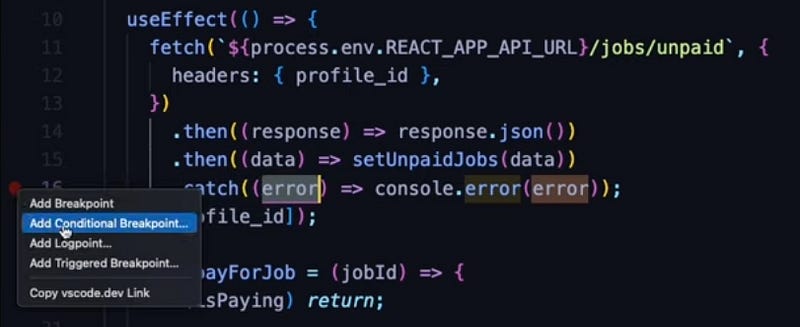
Enter a JavaScript expression that needs to be true for the breakpoint to pause. For example, you might set a condition to error === true to pause only when an error occurs.
Workspaces (Chrome Specific): You can edit your code in your code editor and see the changes reflected in your browser instantly with Workspaces. To enable Workspaces, follow these steps:
Open Chrome DevTools (right-click anywhere on a webpage and select “Inspect” or press F12).
Go to the Sources tab.
In the top right corner, click on the folder icon with a plus sign (+) next to it to enable Workspaces (or drag and drop your project folder here).
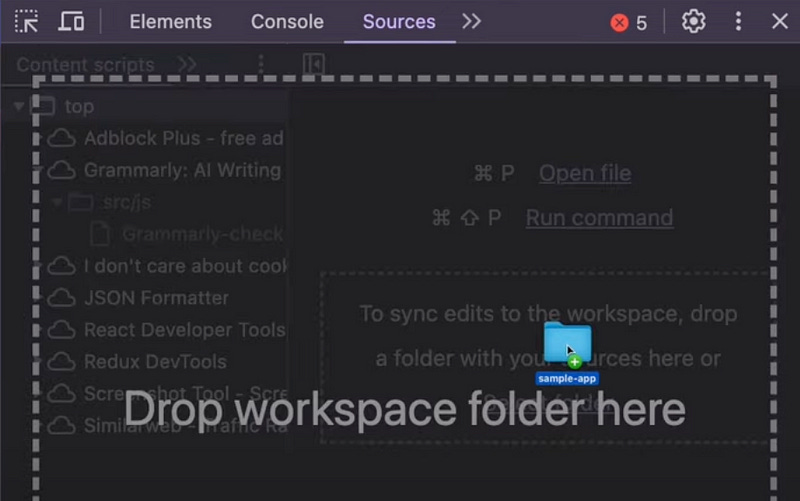
A dialog box will appear. Click “Add folder” and choose the local directory on your machine where your project files are stored. This establishes a connection between your code editor and DevTools.
Now, any changes you make to your code in your favorite editor (e.g., Visual Studio Code, Sublime Text) will be instantly reflected in the browser window within DevTools.
And a bonus tip: You can save time by using keyboard shortcuts. The command menu can be accessed by pressing Ctrl+Shift+P (Windows) or Cmd+Shift+P (Mac), letting you quickly search for and execute specific DevTools actions using keyboard shortcuts.
Hope this was helpful. For better productivity with your code editor, be sure to check out my top 20 VS Code Extensions to Increase Productivity in 2024 + Themes, Icons, & Shortcuts.